Interpretation · Tabulation · Print

Chart reports, tabulations and output

Turn calculated positions into chart analysis, aspect lists, midpoint tables and specialist reports. Arrange material in page layouts and use the output path suited to each view.

Reports

Features at a glance

Chart analysis

  • Chart Analysis
  • Rulerships
  • Horary
  • Aspects List
  • Sorted Aspects
  • Aspects Analysis
  • Chart Point Sort
  • Sensitive Points

Midpoint analysis

  • Midpoint Listing
  • Midpoint Axes
  • Midpoint Trees
  • Midpoint Modes
  • Munkasey Midpoint Weighting Analysis
  • Difference Listing

Points and specialist reports

  • Arabic Parts
  • Star Aspects
  • Star Parans
  • Planetary Nodes
  • Asteroids
  • Extra Bodies
  • Extra Ring Points
  • Developmental Age
  • Speculum
  • Ashtkoot Summary and Detailed reports

Presentation and output

  • Synastry reports
  • Chart tabulations in reusable page layouts
  • Page Designer report objects
  • Dynamic reports and custom columns
  • HTML report and Speculum PDF export
  • Chart and grid printing
  • Print queue
  • Selected chart-data export

Overview

Reports

Draft content: product claims and final screenshots await publication review.

Review the chart's factors

Aspect lists, midpoint material and rulership analysis organise selected chart factors for inspection. Other reports include Lots, star-related material and speculum listings.

Use the report that matches the question. A list of calculated positions and contacts serves a different purpose from a written interpretation.
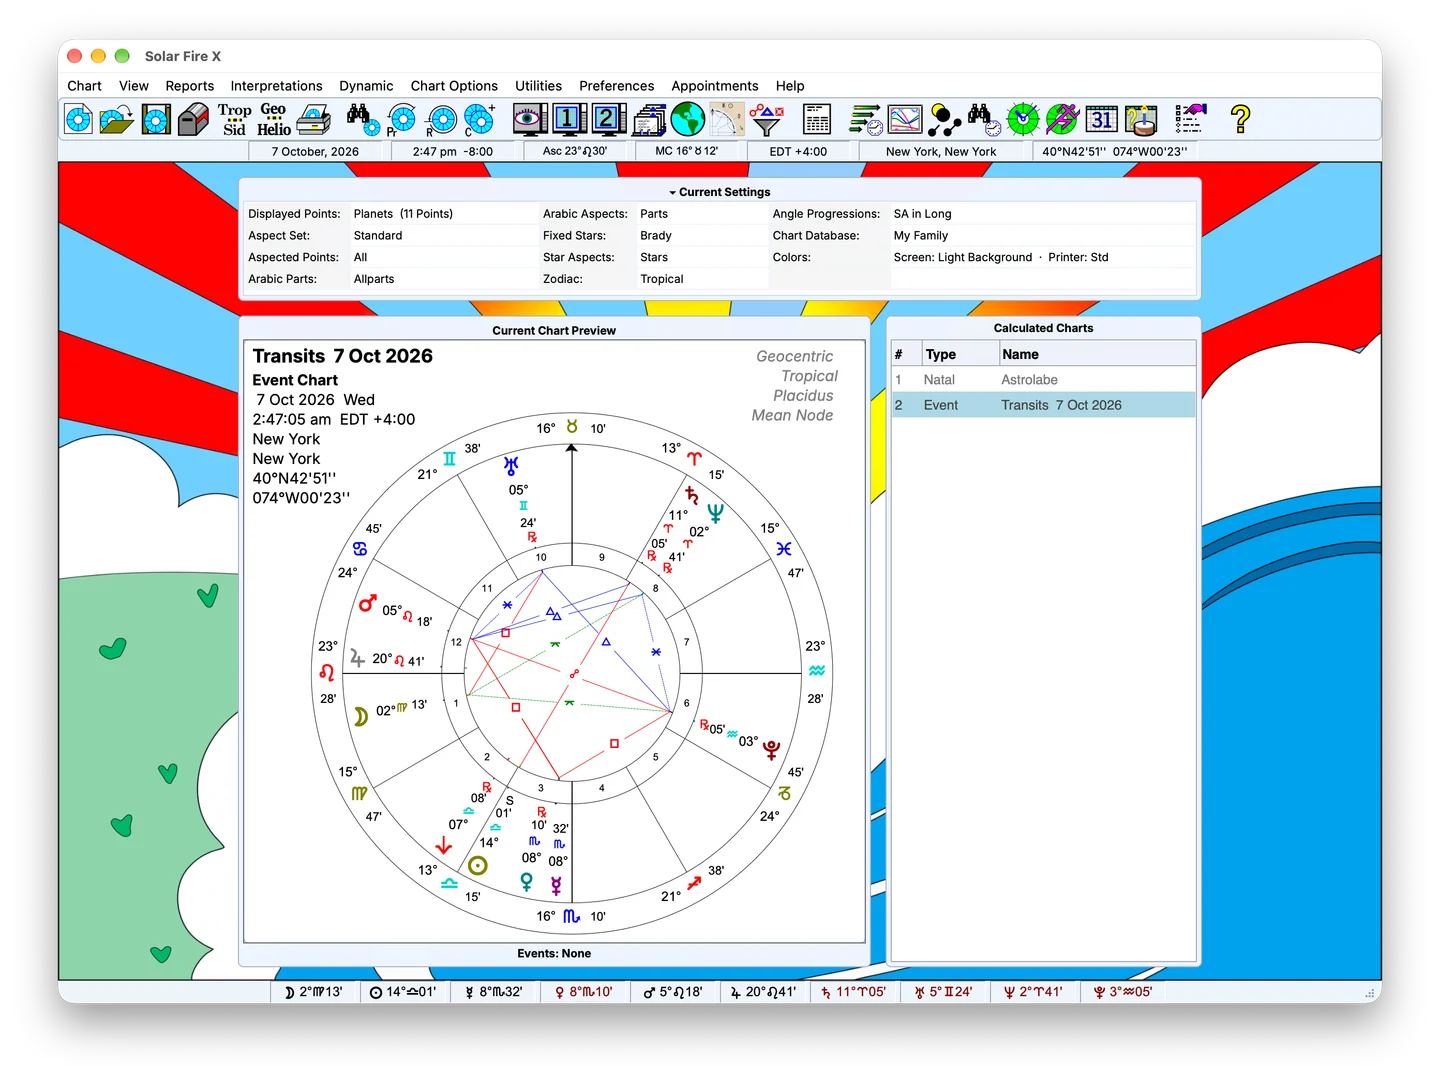
SCREENSHOT: INTERPRETATION READER8 / 5 · PNG
Sample Solar Fire X main screen with chart preview and calculated-chart list; feature-specific screenshot pending

Sample screen — feature-specific screenshot pending

Replace with the interactive interpretations window. 1600×1000 PNG.

In detail

What's inside

Examine tables in context

Tabulations can make house cusps, declination, chart balances and dignity calculations easier to compare. Specialist tables depend on their selected technique and settings.

Where a report applies a scheme or formula, retain that information with the result. A score or listing needs its calculation context to be useful.

FIG. 02 · BEFORE / AFTER: RAW CHART → CLIENT PAGE2 / 1 · PNG
Replace with a paired capture: default wheel beside a designed client page. 1600×800 PNG.

Bring interpretation material alongside analysis

Choose available text to accompany the chart factors you are examining. Review the descriptions, decide what belongs in the reading and develop the connections in your own words.

FIG. 03 · SCREENSHOT: TABULATIONS FOR THE WORKING FILE4 / 3 · PNG
Sample Solar Fire X main screen with chart preview and calculated-chart list; feature-specific screenshot pending

Sample screen — feature-specific screenshot pending

Feature-specific screenshot pending; sample main screen shown for layout review.

Build a reusable layout

Use Page Designer to arrange chart objects and analytical material in a layout suited to study, explanation or consultation. A focused page can make the relationship between a wheel, grid and table easier to follow.

FIG. 04 · SCREENSHOT: RELATIONSHIP TOOLS4 / 3 · PNG
Sample Solar Fire X main screen with chart preview and calculated-chart list; feature-specific screenshot pending

Sample screen — feature-specific screenshot pending

Feature-specific screenshot pending; sample main screen shown for layout review.

Choose the appropriate output

Supported HTML reports and speculum views have a PDF export path. Other chart and bitmap-based views use their own output paths; the available format depends on the surface being exported.

Required formats and permissions need release-specific confirmation for print, image, word-processor and commercial report workflows.

Keep exploring

Related capabilities

Next step

See purchase options for Solar Fire X.

Solar Fire X is one complete instrument — every capability on this page ships in the same program.

Ordering opens Astrolabe's Cart32 catalogue — external site, alabe.com